
Anthropometric, Hemodynamic, Metabolic, and Renal Responses during 5 Days of Food and Water Deprivation
29 April 2020Original Article
Ioannis A. Papagiannopoulos, Institute for Social Medicine, Epidemiology, and Health Economics, Charité – Universitätsmedizin Berlin, Germany
Vassilis I. Sideris, Alexandra Hospital of Athens, Greece
Michael Boschmann, Experimental and Clinical Research Center (ECRC), Charité – Universitätsmedizin Berlin, Germany
Olga S. Koutsoni – Eleni N. Dotsika, Laboratory of Cellular Immunology, Department of Microbiology, Hellenic Pasteur Institute, Athens, Greece
Journal: Complementary Medicine Research
Editor: Karger Verlag
Summary
Background: Although there is considerable research in the field of fasting and fluid restriction, little is known about the impact of food and water deprivation (FWD) on body circumferences and vital parameters. Methods: During 5 days of FWD in 10 healthy adults, hemodynamic, metabolic, and renal parameters, such as weight, 5 circumferences at neck, waist, hip, chest at axilla, chest at nipples, and 1 new oblique hip circumference were measured daily. For each circumference, new quotients of daily circumference-to-weight decrease were calculated. The set of employed parameters quantified and monitored dieting persons’ compliance and efficacy of the method. Results: The values of blood pressure, heart rate, hemoglobin oxygen saturation, glucose, K+, Na+, Cl–, urea, creatinine, and serum osmolality proved to be stable. The mean creatinine clearance increased up to 167%. The mean daily weight decrease (1,390 ± 60 g) demonstrated the effectiveness of FWD in weight reduction. The daily decrease of all measured circumferences and the values of the corresponding circumference-to-weight decrease quotients reflected considerable volume decrease in all measured body parts per day and kg of weight loss during FWD. Conclusion: The intervention of 5 FWD days in 10 healthy adults was found to be safe, decreased weight and all measured circumferences, and improved renal function considerably.
Introduction
Juice and water fasting in the form of Buchinger fasting has been studied and therapeutically applied from the beginning of the 20th century to the present [1–3]. In the last decade, however, increasing evidence has proved benefits of fluid restriction against polyposia [4, 5]. Increased fluid intake was reported to decrease glomerular filtration rate (GFR) [6]. Fluid restriction was found to be beneficial: (a) in surgery, since it reduced complications after partial colectomy [7], (b) in nephrology, since it improved the prognosis of chronic kidney disease (CKD) [8, 9], and (c) in intensive care medicine, since it improved the treatment of lung injury and acute respiratory distress syndrome (ARDS) [10].
However, little is known about food and water deprivation (FWD), and no systematic study has been published investigating anthropometric, hemodynamic, metabolic, and renal responses during FWD. FWD can either occur due to natural or man-caused disasters (earthquakes, war, etc.) or it can be performed voluntarily for religious reasons. From the 1st century A.D. up to the present, orthodox Christians, particularly monks and nuns, practice FWD for several days in the context of Easter fasting. In the 6th and 7th century A.D., famous Byzantine ascetics reported on the hindering effect of polyposia in their descriptions of the spiritual struggle [11] and recommended FWD as potent measure of corporeal and spiritual clarification [12]. In the 5th century B.C., Hippocrates as physician generally prescribed oligoposia and applied FWD in the treatment of acute maladies and chronic diseases [13]. Recently, many volatile compounds, such as acetone, dichloromethane, and toluene, have been detected in the exhaled air of Athos monks after 63 h of FWD [14].
Numerous studies have documented the correlation between anthropometric parameters and disease risk factors. Neck circumference (NC) increase is associated with increase of the risk factors of sleep apnea [15, 16] and insulin resistance [17]. Waist circumference (WC) increase is associated with increase of the risks of death [18, 19], cardiovascular disease (CVD) [20, 21], diabetes [19], metabolic syndrome [17, 21, 22], cancer [23], chronic respiratory disease [24, 25], sleep apnea [16], and kidney stone formation [26]. Waist-to-height ratio (WHtR) increase is associated with increase of the risks of metabolic syndrome [22], CVD [20, 21], and cancer [23]. Waist-to-hip ratio (WHR) increase is associated with increase of the risks of mortality [18], CVD [20], and cancer [23].
The objectives of this study were to a) investigate the effects of FWD on safety-related hemodynamic, metabolic, and renal parameters, b) to complement the set of known anthropometric parameters with new ones, and c) to evaluate the changes of new and old anthropometric parameters during FWD.
Methods
Subjects and Design
In December 2007, 10 apparently healthy individuals (4 men and 6 women of mean age 47.5 years (range 19–66), with mean body mass index (BMI) of 28 kg/m2 (range 19–38), volunteered in this study to be measured and to have their blood and urine tested during 5 days of FWD (table 1). During the 2 days before intervention, the participants had eaten normally and according to their daily habits. In the 3 days following FWD (days 6–8), they gradually returned to a regular nutrition: they drank 3 glasses (250 ml) of juice daily, took some fruit on day 6, a light meal on day 7, and a regular meal on day 8. At any meal during these 3 days, they chewed every bite numerous times (at least 20) and drank juice with a teaspoon and sufficient salivation. The 24-hour day interval was defined from 3.00 p.m. on the previous day to 3.00 p.m. on the current day. At the end of any intervention day (day before intervention to day 5 and day 8 (at 3.00 p.m.), the participants were clinically examined, their body circumferences were measured, and blood and urine tests were performed. During all 10 days of the study, the participants were instructed to sleep sufficiently, go for a walk for 30–60 min daily, and follow their daily activities at a moderate level of intensity. Each participant was informed about the purpose of the daily measurements and signed a written consent prior to the initiation of the clinical and laboratory examinations.
Anthropometric, Hemodynamic, Metabolic, and Renal Measurements
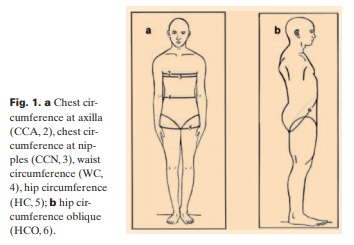
Five circumferences on horizontal and 1 on oblique plane were determined at standing position and at the end of expiration; NC at the level of cricothyroide membrane [17], chest circumference at axilla (CCA) and nipples (CCN) [29], WC immediately under the 12th rib [30], hip circumference (HC) on the gluteal furrow formed between glutei and both thighs [20], and oblique hip circumference (HCO) from the gluteal furrow to the navel (fig. 1). CCA and CCN are not commonly used in epidemiologic studies, although the first reflects the volume of the upper thoracic glove and the second of the lower thoracic glove plus mammary glands. HCO is used here for the first time to evaluate the volume of both hip region and lower abdomen, since none of the known parameters, which can be measured on fixed lines and points of the body, was suitable to evaluate changes in the lower abdomen.
As no parameters describing the change of the above mentioned circumferences per kg of weight lost have been found in the reviewed literature, new quotients of mean daily decrease of the circumferences for mean daily weight decrease (QNC, QCCA, QCCN, QWC, QHC, QHCO) were introduced. These parameters reflect the volume-to-weight change of the corresponding region. The ratios WHtR and WHR were also calculated [17].
In the context of clinical examination, systolic and diastolic blood pressure (SBP and DBP) were measured with a classical quicksilver apparatus (Focal no. FC113, Tokyo, Japan). Heart rate (HR) and hemoglobin oxygen saturation (SatO2) were measured with a pulse oxymeter (Bionics Palmcare, Seoul, Korea). Serum K+, Na+, and Cl–ion concentrations were determined by ion selective electrodes (EasyLyte analyzer, Medica Corporation, Bedford, MA, USA).
Serum urea, creatinine and glucose concentrations, and urine creatinine concentration were measured following standard laboratory methods (ABX Pentra, Horiba, Montpellier, France). Serum osmolality was measured by a cryoscopic osmometer (Osmomat 030 Gonotec, Berlin, Germany). Urine weight for each participant was calculated daily from urine volume and its specific gravity. Each participant noted the approximate weight of stools for all 5 days of FWD, and from these data the approximate mean daily stool discharge was calculated.
Anthropometric data and 24-hour urine volume are presented as additive mean change values per day. For the critical hemodynamic (SBP, DBP, HR, SatO2) and laboratory parameters (serum glucose, serum osmolality, K+, Na+, Cl–, urea, creatinine, creatinine clearance), the mean, maximum, and minimum values are presented, in order to show the degree of safety for each of the participants on a daily basis.
Statistical Analysis
Statistical analysis of data was carried out with the SPSS version 15.0.0 software package (Chicago, IL, USA). 2 nonparametric tests for correlated samples (Friedman and Wilcoxon tests) were used. The Friedman test was applied to all parameters and was used to detect differences from day 0 to day 5 of the intervention.
The parameters, for which cumulative values were used, were calculated as follows: Initially, for every participant the daily change of the relative anthropometric parameter was calculated by subtracting the daily value from the corresponding value of the previous day. Then, the mean daily change was calculated by adding all the daily change values and dividing the outcome by the number of participants. Finally, each mean change value was added to the sum of the predecessor mean values. Data are presented as mean additive change per day.
The minimum, maximum, and mean values for glucose, serum osmolality, K+, Na+, Cl–, urea, creatinine, creatinine clearance, SBP, DBP, HR, and SatO2 are presented for each day. The Friedman test was employed for all values from day 0 to day 5. Differences were considered significant, if the probability (pf) that occurred by chance was < 0.05. Furthermore, the Wilcoxon test was performed to compare the values of day 0 and day 5 and determine pw. For serum glucose, an additional comparison of the values on day 0 and day 3 was made and pw3 was determined. The significance level was regarded positive when pw < 0.05.
Results
Clinical Signs
The clinical examination of the participants showed a satisfactory physical condition of the participants during all 5 days of FWD.
On day 2 and 3, 7 participants showed signs of fatigue, 2 nausea, 1 headache, and 3 muscle pains. However, these symptoms were easily relieved through rest or warm bath and subsided 24–36 h later. On day 4 and 5, all participants had a controllable feeling of thirst, but none showed any signs of dehydration. Interestingly, all participants described intervals of stamina and euphoria.
Hemodynamic Stability
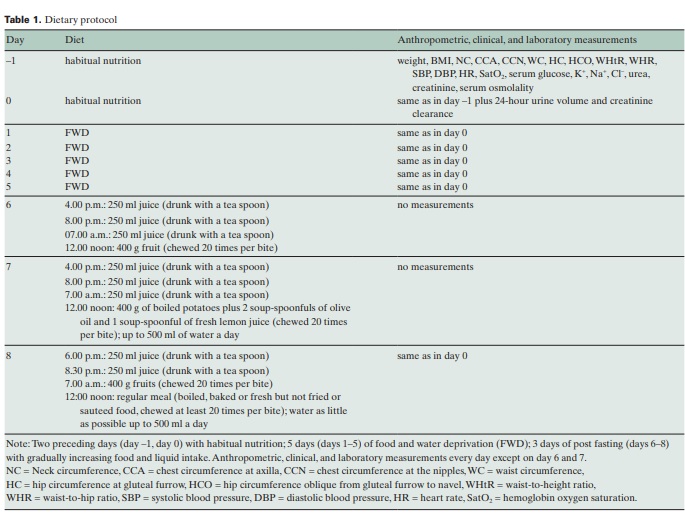
SBP, DBP, HR, and SatO2 did not change significantly from day 0 to day 5, indicating hemodynamic stability of the participants (fig. 2). Heart auscultation and digital graph on pulse oxymeter showed no arrhythmias or pulse abnormality.
Metabolic and Electrolyte Changes
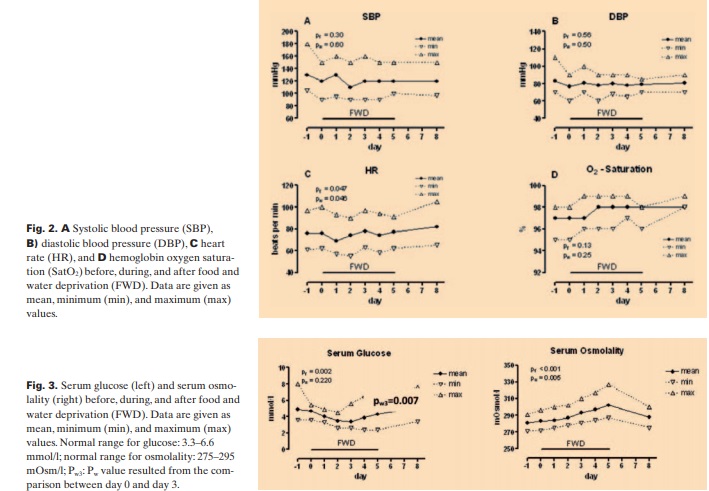
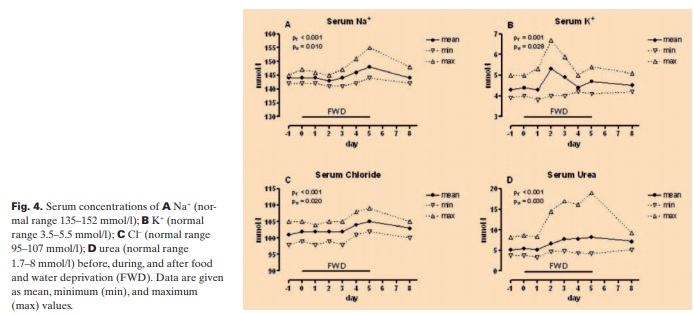
We found that serum glucose decreased significantly to the lowest mean value of 3.4 mmol/l (60 mg/dl) on day 3 (pw3 = 0.007) followed by an increase on days 4 and 5, whereas serum osmolality increased gradually during FWD, reaching its maximum mean value of 302 mOsm/l on day 5 (fig. 3). On the other hand, after 3 days of FWD, urea, Na+, and Cl– gradually increased, reaching the highest mean values of 8.2 mmol/l (49 mg/dl), 148 meq/l, and 105 meq/l on day 5. K+ increased slightly and showed the highest mean value 5.29 meq/l on day 2 (fig. 4). K+ level in 1 participant came close to the critical value of 7 meq/l but did not reach it. The participant had no complaints and no heart rhythm abnormalities.
Creatinine Levels and Creatinine Clearance
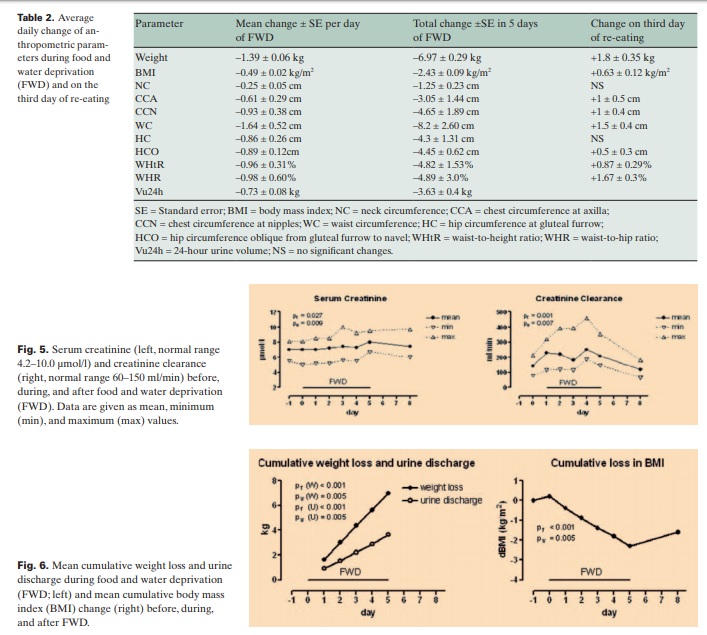
In order to evaluate indicative factors for renal function, we determined the levels of serum creatinine and creatinine clearance. Serum creatinine increased slightly, reaching the highest mean value of 8 μmol/l (0.96 mg/dl) on day 5. Interestingly, there was a considerable increase in creatinine clearance. The mean values were 150 ml/min on day 0 (before FWD), 229 ml/min (+53%) on day 1, 222 ml/min (+49%) on day 2, 181 ml/min (+21%) on day 3, 250 ml/min (+67%) on day 4, and 207 ml/min (+38%) on day 5. 3 days after FWD (day 8), the creatinine clearance was diminished to 125 ml/min (–17%) (fig. 5). Although statically significant, the creatinine increase was not substantial. On the other hand, the increase of creatinine clearance was impressive and without exception. The different magnitude of its increase among the participants could not be correlated with BMI or age.
Changes of Anthropometric Parameters
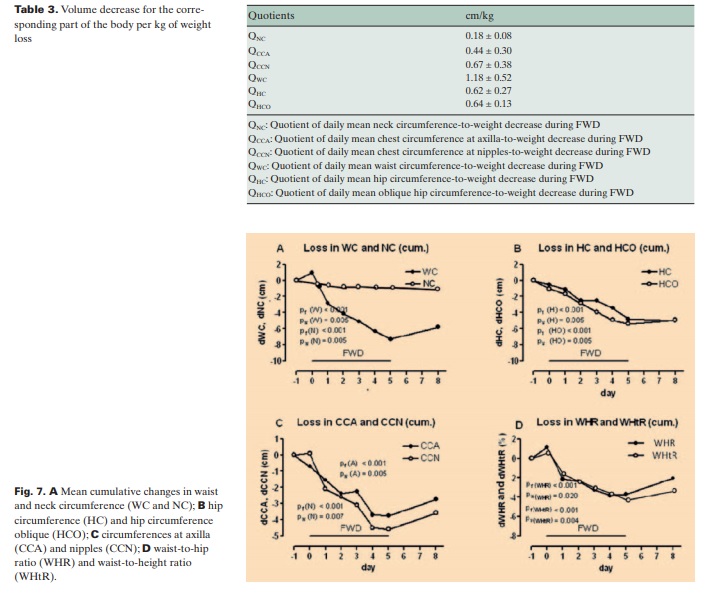
The mean weight loss was 1,390 ± 60 g/day of FWD, whereas the mean urine discharge was 730 ± 80 g/day (fig. 6, table 2). Only 1 participant defecated daily, 4 participants twice (on day 1 and day 3), and 5 participants just once (on day 1). The mean stool discharge was 65 g/day. The remaining 595 g/day plus incorporated inspired O2 equal the insensible water loss plus expired CO2. The daily circumferences’ decrease was considerable. WC showed the most outstanding reduction whereas NC exhibited the lowest alteration. On the third day of re-eating, all these parameters, except for NC and HC, increased between 12 and 34% versus the total decrease (fig. 7, table 2).
The decrease of each circumference per kg of weight loss, as expressed in the values of the quotients QNC, QWC, QHC, QHCO, QCC and QCCN, reflects a considerable volume decrease for the corresponding part of the body per kg of weight loss (table 3).
Discussion
To the best of our knowledge, this paper presents for the first time daily hemodynamic, metabolic, renal, and anthropometric data during FWD. The described anthropometric parameters can be measured quickly, reliably, and reproducibly, since they refer to definite lines and points of the body. The laboratory measurements are simple and cost-effective and can be performed in conventional diagnostic laboratory units. Therefore, monitoring of FWD participants is an easy procedure for physicians without requiring support of advanced equipment.
5 days of FWD contain a triple risk: hypovolemia, hypertonicity, and hypoglycemia. However, our participants have tolerated the dry fasting well and none of them showed hypotension or any noteworthy disorder in HR, SatO2, electrolyte concentration, serum osmolality, and glucose level. It seems that a potent hormonal and nervous contra-regulation results in the effective management of FWD risks.
There is no definite explanation for the temporary K+ increase on day 2. However, no complaints were reported and no heart rhythm changes were registered by any of the participants. Serum glucose decrease on days 1–3 could be attributed to the interruption of food supply, whereas its increase on days 4–5 is probably a result of hormonal contra-regulation.
The mechanism of increased creatinine clearance during FWD could not yet be explained. However, the reported positive association between urine osmolality and GFR and negative association between 24-hour urine volume and GFR [8, 9] are consistent with our findings of decreased urine volume and increased serum osmolality along with GFR increase. We hypothesize that the increasing values of serum osmolality may play a role in the mechanisms of edema mobilization and generalized volume reduction, since they create an increasing osmotic gradient between tissue fluid and blood. This facilitates extra tissue water to be passed to the blood. Extra tissue water from renal parenchyma could also be passed to the blood resulting in decongestion of kidney tissues, improvement of renal microcirculation, and increase of GFR. Furthermore, increasing serum osmolality may cause a gradual declining of the water content of the intestinal walls and lumen, thus decreasing abdominal volume and taking effect on the intestinal flora.
With weight loss of 1,390 ± 60 g/day, FWD seems to be the most effective dietary protocol, since the magnitude of weight reduction is 50–100% more than observed during juice or water fasting [3, 31]. It has to be further investigated whether the impressive weight loss and the remarkable reduction of body circumferences during FWD have any impact on disease risks.
Among the 6 circumferences measured in this study, WC changed most dramatically. The total decrease in WC during FWD corresponds to a huge decrease of the abdominal volume within 5 days. Such a massive and rapid volume decrease can hardly be attributed to the reduction of visceral fat. In view of the total weight loss, urine discharge, and the additional insensible water loss, this volume decrease could be mainly attributed to elimination of edema fluids from the abdominal organs. According to these results, the terms ‘visceral fat’, ‘central obesity’, and ‘abdominal obesity’ or ‘adiposity’ used in various reports [16, 18, 20, 21, 23, 32] may need reconsideration. The risks related to increased WC might be related rather to the edema than to the fat tissue of the abdominal organs. On the other hand, the decrease in NC reflects a considerable volume reduction for such a small part of the body. Removal of muscle spasms in this region could be a conceivable mechanism for this NC reduction. HC and HCO can be seen as volume change detectors for the hip region. HCO is additionally a unique volume change indicator for the lower abdomen and, in this sense, complements the findings on WC in evaluating any changes of the abdominal volume. Consequently, the decreases of HC and HCO reflect a volume reduction in the hip region and lower abdomen during FWD. The CCA and CCN are detectors of thoracic volume changes. Their reduction may result from of the declining of the lung volume. Further research is required to determine any association between this reduction and an increase of the forced expiratory volumes FEV and FEV1, as described with regard to reduction of WC [19, 30].
The new quotients QNC, QCCA, QCCN, QWC, QHC, and QHCO quantify the capability of a weight decreasing method to reduce the volumerelated circumferences. They provide an indispensable tool for monitoring the correspondence of body weight changes and changes of volume-related circumferences. This parallel shows the effectiveness of the diet applied and participants’ compliance. Although the association of some circumferences with disease risk is quite well investigated [15–17, 20, 21], an eventual correlation between the above mentioned quotients and disease risk is yet to be studied.
The present work is a pilot study on FWD. The participants were healthy individuals with normal renal function, the sample size was rather small, the clinical and laboratory parameters were monitored daily, and the physician was experienced. Under these conditions, the method proved to be safe. A deeper insight in the physiology of FWD can be obtained by analyzing the hormonal, hematological, and biochemical profile including oxidative stress parameters. However, the practice of FWD requires further systematic investigation in order to determine limitations and advantages of this method.
Acknowledgments
We are deeply thankful to Michael Mavis for technical assistance.
Disclosure Statement
The authors declare that they have no conflict of interest.