Dry Fasting Physiology: Responses to Hypovolemia and Hypertonicity
18 May 2020Original Article
Ioannis-Eleemon Papagiannopoulos-Vatopaidinos,
Maria Papagiannopoulou – Institute for Social Medicine, Epidemiology, and Health Economics, Charité – Universitätsmedizin Berlin, Berlin, Germany;
Vassilis Sideris – Hellenic Pasteur Institute, Athens, Greece; Alexandra Hospital, Athens, Greece
Journal: Complementary Medicine Research
Editor: Karger Verlag
Abstract
Objective: The aim of this study was to provide a deeper in- sight into dry fasting (DF) physiology.
Design: Ten participants performed DF for 5 consecutive days. Methods: The following parameters were monitored daily: cortisol, aldosterone, high-sensitivity C-reactive protein (CRP), erythropoietin, albumin, uric acid, and vitamin C in serum; vasopres- sin (ADH), adrenocorticotropic hormone (ACTH), renin, an- giotensin II, and total antioxidant capacity (TAC) in plasma; hematocrit and erythrocytes in whole blood; osmolality, nor- adrenaline, dopamine, adrenaline, Na+, and K+ in 24-h urine; waist circumference and body, urine, and stool weight.
Results: The following parameters increased: ADH (60 ± 11%), ACTH (176 ± 34%), cortisol (495 ± 75%), urine osmolality (20± 4%), CRP (167 ± 77%), renin (315 ± 63%), angiotensin II (74± 21%), aldosterone (61 ± 21%), TAC (80.4 ± 17%), uric acid (103 ± 19%), albumin (18.4 ± 2.4%), erythrocytes (13.4 ±2.2%), hematocrit (11 ± 1.8%), and the excretion of noradren- aline (40.3 ± 10%) and dopamine (17 ± 5%). The following parameters decreased: waist circumference (8.20 ± 0.61 cm), body weight (7.010 ± 0.3 kg), erythropoietin (65 ± 18%), and the excretion of adrenaline (38 ± 4%) and Na+ (60 ± 16%). The excretion of K+ remained unchanged. Vitamin C decreased, showing a half-life of 4.8 ± 0.7 days. The percent ratios of lost weight components were: urine (52.2 ± 3.7%), insensible water loss (32.2 ± 1.4%), stool (5 ± 0.3%), and respiratory gases, i.e., expired CO2 – incorporated O2 (10.6 ± 5.4%). Conclusion: The mechanisms underlying the hypertonicity and hypovolemia compensation and the ratio analysis of lost weight components were presented. DF demonstrated short-term antioxidant, anti-ischemic, immune-stimulating, anti-edematous, and anti-inflammatory effects. The results may have an impact on developing new concepts for the treatment of edema, obesity, and inflammatory and ischemic diseases.
Introduction
Fasting is defined as the voluntary abstinence from solid food and stimulants (caffeine, nicotine, alcohol, beverages) for a limited period of time, while the intake of “sufficient” quantities of herbal tea and water is obliga- tory [1].
Dry fasting (DF), also called food and water depriva- tion [2], is defined as the abstinence from any food or hydration. Although introduced by Hippocrates [3], modern research on it began only recently [4]. In a study on human DF for 5 successive days, prepared by our group, the mean cumulative decreases in anthropometric parameters were 6.97 kg in body weight, 8.2 cm in waist circumference, 4.3 cm in hip circumference, 4.4 cm in oblique hip circumference, 4.6 cm in chest circumference at nipples, 3.05 cm in chest circumference at axilla, and 1.25 cm in neck circumference [2].
Due to the uninterrupted excretory and metabolic ac- tivity of the organism, DF involves 3 risks: (a) blood hy- pertonicity, (b) hypovolemia, and (c) hypoglycemia. The first risk is a particular consequence of insensible water loss (i.e., pure water loss), the second one of urine discharge (i.e., water and electrolyte loss) and insensible wa- ter loss, and the third one of fueling of metabolism.
Yet, the participants in the aforementioned study demonstrated normal blood pressure, heart rate, and hemoglobin oxygen saturation, safe values in serum creatinine, urea, K+, Na+, and glucose, a moderate increase in serum osmolality and a substantial increase in glomerular filtration rate [2]. These observations show the effective compensation of all 3 risks and indicate subtle back- ground mechanisms, orchestrating the responses of all involved systems and organs. The objective of the current study was to explore the mechanisms underlying the hypovolemia and hypertonicity compensation, whereas the investigation of the mechanisms underlying the hypogly- cemia compensation may be the object of a future study.
Subjects and Methods
Subjects and Design
From the 1st century A.D. till the present, Orthodox Christians have been practicing DF during Lent and before important reli- gious events. Therefore, we had no difficulties in finding people who were already practicing DF and willing to provide blood, urine, and stool samples for our research. The participants includ- ed 10 healthy adults (3 men, 7 women), who were residents of Ath- ens. Their average age, weight, height, and body mass index (BMI) were 49.5 years (range 30–65), 85.3 kg (range 58–102), 1.7 m (range 1.60–1.89), and 29.5 kg/m2 (range 20–39), respectively. Ap- plying the formula of Du Bois and Du Bois [5], the mean body surface area was calculated at 1.97 m2. The participants were not on any medications. They were informed about the purpose of daily measurements and they provided written consent prior to data collection.
The dietary protocol was identical to that used in our previous work on DF: 5 consecutive days of DF (Days 1–5; actual dates May 12–16, 2014), preceded by 2 days (Days –1, 0) during which the participants ate in accordance with their dietary habits. DF was followed by 3 days (Days 6–8) during which the participants grad- ually returned to a regulated diet [2]. However, the definition of the 24-h interval was different, ranging from 20:00 on the previous day to 20:00 on the current day.
At the end of each of the Days –1 to 5 and 8, the following pa- rameters were measured: cortisol, high-sensitivity C-reactive pro- tein (CRP), erythropoietin (EPO), albumin, uric acid, vitamin C in serum, vasopressin (ADH), adrenocorticotropic hormone (ACTH), and total antioxidant capacity (TAC) in plasma, and he- matocrit and erythrocyte count in whole blood. At the end of each of the Days 0 to 5 and 8, osmolality, noradrenalin, dopamine, adrenaline, Na+ and K+ levels in 24-h urine, renin and angiotensin II levels in plasma, and aldosterone level in serum were determined.
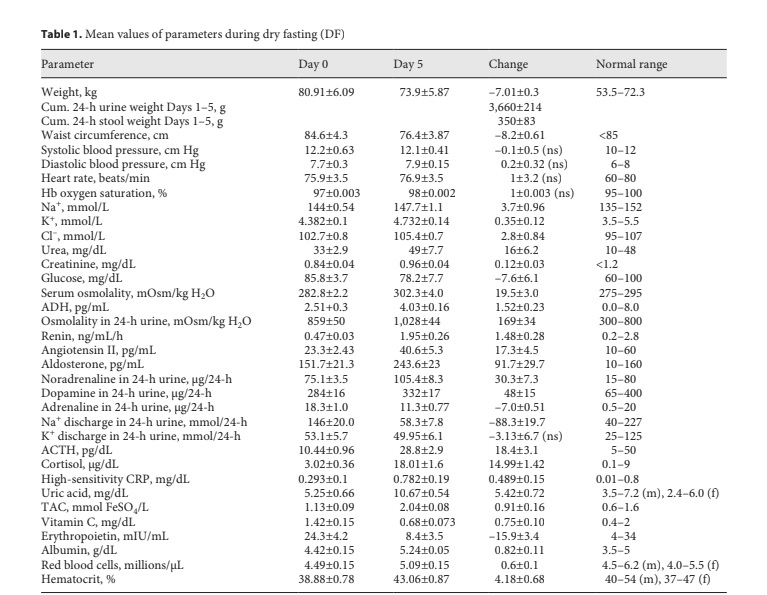
Change in mean values (with standard error) of parameters during DF. ACTH, adrenocorticotropic hormone; ADH, vasopressin; CRP, C-reactive protein; Cum., cumulative; f, female; Hb, hemoglobin; m, male; ns, non-significant; TAC, plasma total antioxidant ca- pacity.
At the end of each of the Days 0 to 5, waist circumference and body, urine, and stool weight were measured. At the end of each of the Days 0 to 5 and 8, blood pressure, heart rate, hemoglobin oxygen saturation, and serum Na+, K+, Cl–, urea, creatinine, glu- cose, and osmolality were measured to re-test DF’s short-term safety. Based on the same parameters, participants were monitored monthly until October 2018 to test the long-term safety of the method.
Hormonal, Biochemical, and Hematological Measurements
An enzyme-linked immunosorbent assay analyzer Expert 96 (ASYS Hitech, Austria) was used to measure ADH (Cayman Chemical, USA), EPO (Bender MedSystems, Austria), and renin, angiotensin II, and aldosterone (IBL International, Germany). Osmolality in urine and serum was measured using a cryoscopic osmometer (Osmomat 030, Gonotec, Germany). Urine catechol- amines were measured by electrochemical detection with high- performance liquid chromatography (Merck Hitachi LaChrom, Germany). Ion selective electrodes (EasyLyte Analyzer, Medica Corporation, USA) measured Na+ and K+ in serum and urine and Cl– in serum. An immunoassay analyzer (Immulite 1000, Siemens, Germany) was used to measure ACTH and cortisol. Serum CRP, albumin, uric acid, urea, creatinine, and glucose levels were measured following standard biochemical laboratory methods (ABX Pentra, Horiba, France). Erythrocytes’ count and hemato- crit were measured using a Coulter Act 5diff (Beckman Coulter, USA). Plasma TAC was measured spectrophotometrically (Hitachi U-1800 UV-Vis spectrophotometer), using the manual meth- od by Benzie and Strain (ferric reducing ability of plasma). Vita- min C level was measured spectrophotometrically (Sigma-Ald- rich assay kit, USA). Through a quicksilver apparatus (Focal No. FC113, Japan) and a pulse oximeter (Bionics PalmCare, Korea), blood pressure and heart rate and hemoglobin oxygen saturation were measured.
Statistical Analysis
Statistical analysis of values on Days 0–5 was performed using the SPSS v.15.0.0 software package (USA). Two nonparametric tests for correlated samples, namely the Friedman and Wilcoxon tests, were employed. The Friedman test (pf denotes its p value) was used to detect differences across multiple days of the study (Days 0–5) for all parameters. The Wilcoxon test (pw denotes its p value) was used to assess differences between measurements on Days 0 and 5 for all parameters.
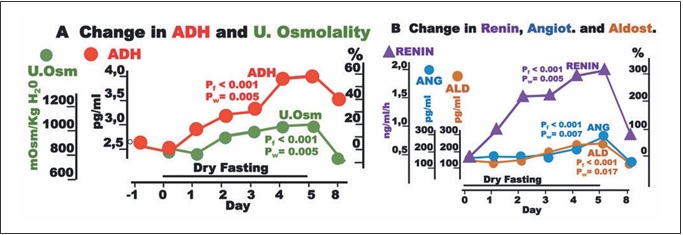
Fig. 1. Responses to hypovolemia and hypertonicity during dry fasting. A Serum concentration of vasopressin (ADH) in pg/mL (1 pg/ mL = 0.922 pmol/L) and urine osmolality (U.Osm) in mOsm/kg H2O. B Renin activity in supine position (Renin) in ng/mL/h (1 ng/ mL/h = 11.38 mIU/L/h), and angiotensin II (ANG) in pg/mL (1 pg/mL = 0.956 pmol/L), and aldosterone (ALD) in pg/mL (1 pg/mL = 2.774 pmol/L), respectively. The curves display changes in mean values in absolute and percent scales.
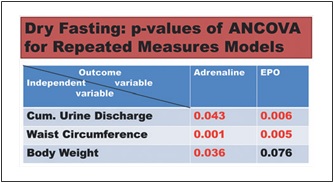
Fig. 2. Synopsis of p values of ANCOVA for repeated measures models analysis. Red and black numbers indicate positive and neg- ative associations respectively. Cum., cumulative; EPO, erythro- poietin.
We also used ANCOVA for repeated measures models to in- vestigate the relationship of the outcome variables erythropoietin and adrenaline (Days 0–5), respectively, with the independent variables (a) cumulative urine weight, (b) waist circumference, and (c) body weight. The independent variables were included in the model one at a time. The selection of these 3 variables was not ar- bitrary: they were the parameters of fluid elimination, volume change, and weight change with the maximal change [2]. We con- sidered that the combination of cumulative urine discharge with either body weight or waist circumference (or both) could approx- imately quantify the edema elimination, which is not measurable per se.
For all tests, the level of statistical significance was set at p <0.05.
Results
Symptoms and Critical Clinical and Laboratory
Parameters
All participants were following their daily duties at a moderate level. On Days 2 and 3, 5 of them showed signs of fatigue, 1 nausea, 5 headache, and 2 muscle pains. On Days 1–5, 3 of them complained of intervals of muscular weakness, whereas on Days 4 and 5, all participants men- tioned a mild thirst feeling and a governable desire for fresh, sour, juicy, and sweet fruit. In spite of the observed high values of uric acid, none of the participants devel- oped signs of gout. Instead, all banal spine and joint pains gradually disappeared.
Through Days 0 to 5 and 8, all of them demonstrated hemodynamic stability with safe values of blood pressure, heart rate, hemoglobin oxygen saturation, and serum Na+, K+, Cl–, urea, creatinine, glucose, and osmolality (Table 1). The respective graphs and p values were not included here since they were almost identical to those observed in our previous study [2]. Until October 2018, the values of all critical parameters remained exactly at the pre-DF level.
Change in Waist Circumference, Body Weight, and Excretions
The mean cumulative changes in waist circumference, weight, urine discharge, and stool discharge through Days 1–5 were 8.2 ± 0.6 cm, 7.01 ± 0.30 kg, 3.66 ± 0.21 kg, and 0.35 ± 0.08 kg/5 days, respectively (Table 1). The re- mainder of the weight loss (3.0 ± 0.37 kg/5 days) was the sum of the mean cumulative insensible water loss and net weight of respiratory gases (expired CO2 – incorporated O2). The graphs and p values of the waist circumference and body and urine weight were almost identical to those in our previous study [2]. Hence, they were also not in- corporated here. The stool discharge was so infrequent that only the standard error but not the p values could be calculated.
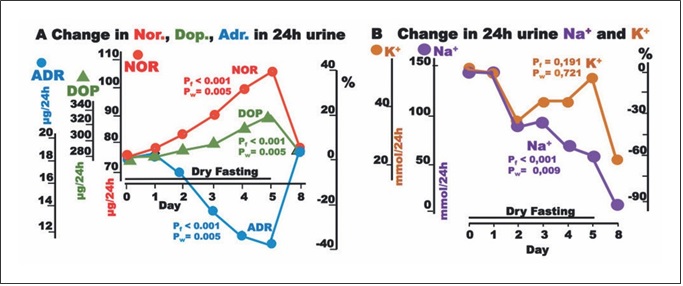
Fig. 3. Responses to hypovolemia and hypertonicity during dry fasting. A Noradrenaline (Nor.), dopamine (Dop.), and adrenaline (Adr.) in μg/24-h; Nor., 1 μg = 5.91 nmol; Dop., 1 μg = 6.53 nmol; and Adr., 1 μg = 5.46 nmol. B Na+ and K+ in 24-h urine, in mmol/24 h. The curves display changes in mean values in absolute and percent scales.
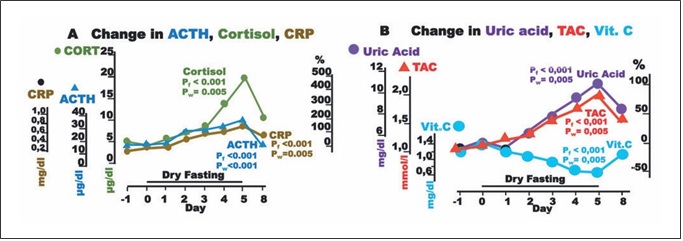
Fig. 4. Responses to hypovolemia and hypertonicity, and oxidative stress parameters during dry fasting. A Serum concentration at 20:00 of cortisol (CORT) in μg/dL (1 μg/dL = 27.59 nmol/L), ACTH in pg/mL (1 pg/mL = 0.22 pmol/L), and CRP in mg/dL (1 mg/ dL = 0.48 μmol/L). B Serum concentration of uric acid in mg/dL (1 mg/dL = 59.48 μmol/L), vitamin C (Vit. C) in mg/dL (1 mg/dL = 56.78 μmol/L), and plasma total antioxidant capacity (TAC) in mmol/L FeSO4. The curves display changes in mean values in absolute and percent scales.
Hormones and Other Blood and Urine Parameters
The mean values of the following parameters, with the only exception of urine K+, changed gradually across the consecutive DF days, ultimately reaching their extremes on Day 5 (Table 1).
Hypovolemia and Hypertonicity Defense
Significant increases in ADH, urine osmolality, renin, angiotensin II, and aldosterone toward their extremes (60± 11, 20 ± 4, 315 ± 63, 74 ± 21, and 61 ± 21%, respective- ly) were observed (Fig. 1).
The discharge of noradrenaline and dopamine in 24-h urine showed significant increases to the extremes of 40.3 ± 10 and 17 ± 5%, respectively, while that of adrenaline showed a significant decrease (38 ± 4%). In our ANCO- VA for repeated measures models, adrenaline was sig- nificantly associated with cumulative urine discharge, waist circumference, and body weight (Fig. 2).
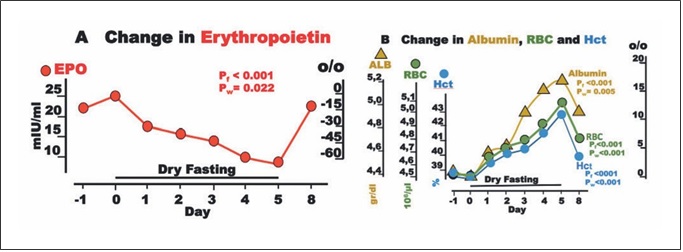
Fig. 5. Erythropoietin (EPO) and blood constituents during dry fasting. A EPO in IU/L. B Serum concentration of albumin (ALB) in g/dL (1 g/dL = 0.15 mmol/L), erythrocyte concentration (RBC) in 106/μL, and hematocrit (Hct) in % units. The curves display changes in mean values in absolute and percent scales.
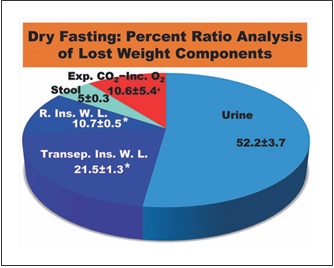
Fig. 6. Percent ratio analysis of lost weight components. Exp. CO2, expired CO2; Inc. O2, incorporated O2; R. Ins. W. L., respiratory insensible water loss; Transep. Ins. W. L., transepidermal insensi- ble water loss; *, Calculated on the basis of literature data; +, Re- maining percentage.
Urine Electrolytes
Na+ discharge in 24-h urine decreased to the minimum at 60 ± 16%. In contrast, there was no significant change in K+ discharge (Fig. 3). On Day 8, the excretion of both electrolytes demonstrated a further decrease.
Upregulated Hypothalamic-Pituitary-Adrenal Axis and CRP
Aside ADH, large increases in ACTH, cortisol, and CRP up to their maxima (176 ± 34, 495 ± 75, and 167 ±77%, respectively) were observed.
Oxidative Stress Parameters
Plasma TAC and uric acid increased to their maxima at 80.4 ± 17 and 103 ± 19%, respectively, whereas vitamin C decreased to its minimum at 52.4 ± 8.9% (Fig. 4).
Change in EPO and Blood Constituents
EPO fell to a minimum of 65 ± 18%. Interestingly, EPO was significantly associated with cumulative urine dis- charge and waist circumference but not with body weight in our ANCOVA for repeated measures models (Fig. 2). Erythrocyte count and hematocrit increased up to their maxima (13.4 ± 2.2 and 11 ± 1.8%, respectively), whereas albumin level demonstrated a steeper rise to 18.4 ± 2.4% (Fig. 5).
Discussion
In this section, the changes in parameters induced by DF are commented. Wherever unavoidable, brief sum- maries of the physiology of volume and tonicity defense are included.
Hypovolemia and Hypertonicity: Sensing and
Defending
Hypovolemia and increase in plasma osmolality, Na+, and angiotensin trigger, through baro-, osmo-, Na+-, and angiotensin receptors respectively [6, 7], the secretion of ADH by magnocellular and parvocellular neurons, locat- ed in the hypothalamic supraoptic and paraventricular nuclei. After secretion, ADH binds to 3 receptors: V1b, which mediates the release of ACTH in the anterior pituitary; V1a, which mediates blood vessel constriction, liver glycogenolysis and neoglucogenesis, adrenal aldosterone and cortisol secretion, and influences learning, memory, and social behavior; and V2, which mediates water reab- sorption in the kidney [8, 9]. This last action of V2 recep- tors proceeds through the activation of 3 mechanisms: (1) promotion of Na+ reabsorption throughout the distal nephron via epithelial sodium channels; (2) urea reabsorption in the terminal inner part of the collecting duct via the urea transporter UT-A1; and (3) increased water permeability via aquaporin-2 [10].
Thereafter, it becomes clear that the increase in ADH secretion during DF compromised the increase in serum osmolality and contributed significantly to hemodynam- ic stability [2] (Table 1) through (a) vasoconstriction; (b) increase in serum urea; (c) restriction of urine volume [2]; (d) increase in urine osmolality; (e) decrease in natriuresis; and (f) aldosterone, ACTH, and cortisol increase (Ta- ble 1; Figs. 1, 3, 4).
ADH generates a steeper axial corticomedullary os- motic gradient [10], resulting in increased concentrat- ing ability of the kidney. Consequently, ADH alone can upgrade renal function. This may be one of the explana- tions of the increased glomerular filtration rate during DF [2].
Due to hypovolemia, efferent impulses from the afore- mentioned paraventricular nucleus stimulate sequentially neurons in the rostral ventrolateral medulla, preganglionic nerve cells of the intermediolateral spinal column, postganglionic efferent sympathetic noradrenergic nerves, and terminal organs, including the blood vessels (vasoconstriction), heart (positive inotropic effect), and kidneys (renin increase) [7]. Hypovolemia stimulates the release of noradrenalin in both neural synapses [7] and adrenals. Hypoglycemia stimulates, through neuro-sym- pathetic circuits, the secretion of adrenaline alone [11] (see below).
Besides through hypothalamic-sympathetic efferents, hypovolemia directly activates the renin-angiotensin-al- dosterone system (RAAS) [7]. Furthermore, the release of angiotensin II is also stimulated by ADH, and that of al- dosterone by ADH [8] and ACTH [12]. This multiple- stage activation of RAAS may explain the generous in- crease in all 3 hormones observed in the present study (Table 1; Fig. 1). Angiotensin II and aldosterone, through direct vasoconstriction and reabsorption of Na+, Cl–, and H2O [8], respectively, contributed to the hemodynamic stability [2] and decrease in natriuresis observed here (Table 1; Fig. 3).
Natriuretic, Kaliuretic, and Diuretic Effects
Despite the absolute Na+, K+, and water deprivation and the respective adjustments through Days 1–5, par- ticipants continued to excrete significant amounts of all three substances. Under this consideration, DF had natri- uretic, diuretic, and kaliuretic effects. The natriuretic and diuretic effects contribute significantly to edema elimina- tion. The kaliuretic effect may be of some importance in the context of renal insufficiency management.
On day 8, the elimination of Na+ and K+ in 24-h urine exhibits a further decrease. This is not an unexpected finding, since there is a weight regain in the re-eating phase. On Days 6, 7, and 8, total food, water, and juice intake amounted to 1,150, 1,650, and >2,000 g, respec- tively [2], whereas the mean weight loss on each DF day was 1,402 g. This means that there is a supply deficit on Day 6, a negligible surplus on Day 7, and a substantial surplus only on day 8. Hence, the weight regain after DF has to be attributed to a retention of Na+, K+, Cl–, and wa- ter on Day 8.
Ratio Analysis of Lost Weight Components
Insensible water loss has 2 components, a respiratory and a transepidermal one. The values of these compo- nents were previously found to be 150 mL/day (22 ° C, 50% relative humidity) [13] and 6.39 ± 0.31 g/m2/h (24 °C, 31.3% relative humidity) [14], respectively. During our data collection, the mean temperature and relative hu- midity in Athens were 19.3 ° C and 54.2%, respectively [15, 16]. As these climatic conditions were comparable to the referred ones, we used these data, in combination with the aforementioned mean body surface area, to approximate the respective mean cumulative values in our study. These were calculated at approximately 0.750 and 1.509± 0.072 (kg/5 days), respectively. With the ratios of urine and stool being 3.66 ± 0.21 and 0.35 ± 0.08 kg/5 days, re- spectively, the ratio of respiratory gases (expired CO2 – incorporated O2) results in 0.741 ± 0.382 kg/5 days. Hence, the percent ratios of lost weight components were: urine 52.2 ± 3.7%; stool 5.0 ± 0.3%; respiratory and transepidermal insensible water loss approximately 10.7± 0.5% and 21.5 ± 1.3%, respectively (in total 32.2 ± 1.4%); and respiratory gases approximately 10.6 ± 5.4%. Accord- ingly, approximately 90% of the lost weight is discharged in the form of water in urine, stool, and insensible water loss (Fig. 6), emphasizing the strong water eliminating ef- fect of DF.
Combined with the aforementioned decreases in body weight and circumferences [2] (Table 1), these results suggest that DF may reduce both body weight and body volume, predominantly by means of eliminating water and electrolytes. They also point to the accumulation of edema, as a possible cause of the increase in both weight and volume.
These observations may trigger the development of new concepts for etiology, prevention, and treatment of obesity.
DF, Hypothalamic-Pituitary-Adrenal (HPA) Axis, and CRP
Hypovolemia, hypertonicity, and hypoglycemia are all major threats to homeostasis (stressors). Hence, DF is ex- pected to potently stimulate both ADH and corticotro- pin-releasing hormone (CRH) and upregulate the HPA axis [6, 17, 18]. The increase in CRH, although not mea- sured here, can be extrapolated, since it is required for the substantial ACTH and cortisol increase [18] observed here. The upregulated HPA axis has proinflammatory (partly immune-stimulating) and anti-inflammatory ef- fects [19–21]. One of the proinflammatory actions is the increase in interleukin 6 [19], which is known to stimu- late CRP production [22], which is confirmed here (Table 1; Fig. 4).
These data may stimulate the development of new metabolic diagrams for the treatment of a series of in- flammatory diseases.
Antioxidant Effect of DF, Uric Acid, and Vitamin C
Uric acid, the product of purine breakdown, is in- volved in the development of gout and metabolic syn- drome, whereas it may play a role in resistance to neuro- logical, autoimmune, and infectious diseases [23]. It is also the principal plasma antioxidant and radical scaven- ger [24, 25], and its change during DF was a crucial con- tribution to the increase in TAC. Vitamin C, the other significant plasma antioxidant [26], decreased, compro- mising the increase in TAC (Fig. 4). The decrease in vita- min C is surely a negative effect of DF and belongs to the factors limiting its application time. Respective to the ob- served nadir of vitamin C (52.4 ± 7.2%) on Day 5, its half- life time (t1/2) is 4.8 ± 0.7 days. DF, as the gold standard of vitamin C deprivation, provided this specific t1/2 time, which is quite different from those previously reported [27, 28].
Changes in EPO, Blood Constituents, and Cell Oxygen
Supply
Erythrocytes comprise about 40% of the intravascular volume. Any volume decrease, even if accompanied by an increase in hematocrit, triggers a rise in EPO [29]. Angio- tensin II is known to stimulate EPO secretion, despite he- matocrit increases [30]. This specific EPO adjustment helps to restore the blood volume deficit. Growth hor- mone is another stimulus for EPO secretion [31] and, al- though not measured here, is known to increase in any fasting form [32]. In the short time of application of this method, other minor stimuli can cause only slight chang- es in EPO level [31]. Accordingly, a generous increase was expected. Instead, a substantial decrease was measured
(Table 1; Fig. 5).
Any change in cell oxygen supply modulates specifi- cally and effectively the production of EPO via the tran- scriptional activators hypoxia-inducible factors (HIFs) [31, 33]. In the current study, an increase in cell oxygen- ation probably overshadowed all stimulating mecha- nisms, resulting in this unexpected change in EPO, for which we have been able to find no other explanation.
The progressing hemoconcentration during DF should result in an identical increase in (a) albumin, (b) erythro- cyte count, and (c) hematocrit. However, the decreasing EPO compromised the increase in parameters (b) and (c). Via a decrease in erythrocyte volume [6], the increase in serum osmolality [2] (Table 1) compromised further the change in parameter (c) alone. The end result was the di- vergence of the respective 3 curves (Fig. 5).
Changes in Adrenaline and Cell Oxygen Supply
The biosynthesis of catecholamines proceeds through the sequential conversion of tyrosine to L-3,4-dihydroxy- phenylalanine, dopamine, noradrenaline, and adrena- line, catalyzed by tyrosine hydroxylase, L-3,4-dihydroxy- phenylalanine decarboxylase, dopamine-β-hydroxylase, and phenylethanolamine N-methyltransferase (PNMT) respectively. The expression of tyrosine hydroxylase, dopamine-β-hydroxylase, and PNMT are controlled by hormonal and neural stimuli. Cortisol (delivered mainly via intra-adrenal portal circulation) stimulates the secre- tion of dopamine, noradrenaline, and adrenaline, particularly promoting PNMT expression and inhibiting its degradation. Differentiated cells in the rostral ventrolateral medulla receive input from glucosensors, and, through the respective intermediolateral spinal column cells, relay their output to adrenomedullary adrenergic cells. Other cells in the rostral ventrolateral medulla re- ceive input from the baroreceptors, and, through the respective intermediolateral cells, relay their output to adrenomedullary noradrenergic cells. Thus, it appears that hypoglycemia and hypovolemia stimulate, through sym- pathetic output, separately adrenaline and noradrenaline secretion respectively, and baroreceptors cannot modulate adrenaline secretion at all [11]. Accordingly, an ample increase in adrenalin was expected during DF. In its place, a substantial decrease was observed.
Our strong hypothesis is that a third regulatory mech- anism, analogous to that described in the preceding part, accounts for this unexpected result: an increase in cellular oxygenation triggers a decrease in HIFs and intracellular oxidative stress, thereby inhibiting PNMT expression [34, 35]. This suppressing mechanism is the only one, which can dominate over the aforementioned stimulating ones and effect the adrenaline decrease observed here. This explanation is consistent with the hypothesis that HIFs are an “on-off” switch that regulates adrenaline se- cretion upon homeostatic threats [34].
The decrease in both EPO and adrenaline suggests an anti-ischemic effect of DF and may have significant implications in generating new methodologies for the treatment of ischemic diseases.
The association of adrenaline and EPO with both edema elimination (Fig. 2) and improved cellular oxygen- ation raises the question of whether edema elimination and improved cellular oxygenation are causally linked. This question is apparently of paramount therapeutic im- portance.
Summary, Limits, and Future Perspectives of DF
In this first study on DF physiology, the mechanistic background of hypertonicity and hypovolemia compensa- tion was presented. The results may trigger the developing of new metabolic approaches for the treatment of edema and inflammatory and ischemic diseases. The ratio analysis of lost weight components, in combination with the so- matometric changes, may lead to the development of new etiology, prevention, and treatment concepts for obesity.
Even compensated, hypovolemia, hypertonicity, and vitamin C decrease limit the application time of this method to a few days. Hence, it can have only short-term effects, whereas medical supervision becomes obligatory. Furthermore, the compensation mechanisms require ob- viously an intact endocrine and renal function. Thus, individuals with pituitary, adrenal, or renal insufficiency should not participate in multiple-day DF.
Statement of Ethics
The participants were informed about the purpose of daily measurements and they provided written consent prior to data collection. Since DF belongs to religious customs of orthodox peo- ples and has been followed for about 2000 years, no ethics commit- tee approval was sought and provided.
Disclosure Statement
There are no conflicts of interest to declare.
Funding Sources
No financial support was received.
Availability of Data and Materials
All data are available in this article as online supplementary material (see www.karger.com/doi/10.1159/000505201).